
The problem is structural. CRM dashboards live in one system, training completion logs in another, and revenue outcomes in a third. With no bridge between them, it's nearly impossible to know what's actually driving performance improvements — or what's quietly draining them.
This article covers which metrics matter for win rate, how to connect training inputs to revenue outcomes, and what breaks down when that discipline is absent.
Key Takeaways
- Sales enablement measurement tracks whether training is improving rep performance — not just whether reps completed a module
- Win rate is the single most important lag measure for evaluating training effectiveness
- Tracking both lead measures (training activity) and lag measures (revenue outcomes) creates a complete, actionable picture
- Only 25.7% of organizations consistently measure enablement impact using both leading and lagging indicators
- Reinforcement after training — not the initial session — is what drives sustained metric gains; the program alone rarely makes them stick
What Sales Enablement Measurement Actually Is
Sales enablement measurement is the practice of tracking KPIs that show whether training, content, coaching, and processes are translating into actual sales performance — not just rep activity.
It spans two layers:
- Internal metrics — rep readiness, skill proficiency scores, training participation, coaching session frequency
- External outcomes — win rate, deal size, sales cycle length, quota attainment
The real insight comes from connecting both layers.
A Feedback Loop, Not a Reporting Exercise
The most effective enablement organizations treat measurement as a continuous loop. Metrics surface what to train. Training shifts behavior. Then metrics confirm whether anything actually changed. Organizations that keep training and measurement in separate silos — one owned by L&D, the other by revenue leadership — rarely close that loop.
Without shared accountability, training has no feedback mechanism and no proof of impact. Embed measurement from the start, and it becomes the mechanism that turns training from a line-item expense into a documented performance driver.
Three Advantages of Tracking Sales Enablement Metrics
Each advantage below maps directly to a business outcome sales leaders are already accountable for. The goal isn't measurement for its own sake — it's measurement that changes decisions.
Win Rate Improvement Through Targeted Skill Development
Win rate — the percentage of opportunities that convert to closed-won deals — is the clearest signal that reps have the skills, messaging, and confidence needed to close. It's also the lag measure that sales enablement training should ultimately move.
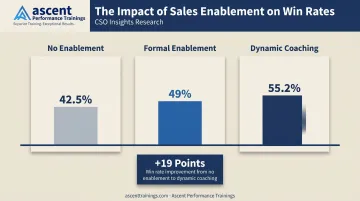
Research from CSO Insights found that organizations with formal sales enablement achieved 49% win rates on forecast deals, compared to 42.5% for organizations without enablement — a 6.5 percentage point gap. Organizations with dynamic sales coaching saw win rates reach 55.2%, a 19-point improvement over the study average.
Structured programs focused on objection handling, consultative discovery, and buyer communication change the specific behaviors that determine win/loss outcomes. Attribution only works, however, when those skills are tracked before and after training — so improvements can be tied to specific programs, not just general momentum.
KPIs impacted: Win rate, opportunity-to-deal conversion ratio
When this matters most: Competitive B2B markets, complex enterprise sales with multiple decision-makers, industries with long buying cycles — technology, financial services, oil and gas
Reduced Rep Ramp Time (Time to First Deal)
Time to first deal measures how long a new rep takes to close their first sale after onboarding. It's a direct measure of how efficient the training and onboarding program actually is — not how comprehensive it looks on paper.
CSO Insights reported that it takes an average of 9.2 months to get a new sales hire to full productivity. That's nearly a year of partial output per hire. When ramp time is actively measured, enablement leaders can identify which onboarding activities accelerate readiness and which are ceremonial — then redirect resources toward training that produces selling behavior faster.
The downstream effects compound quickly:
- Faster ramp reduces revenue drag during the onboarding window
- Stronger onboarding correlates with higher retention — CSO Insights found voluntary turnover at 7.9% for organizations with strong onboarding programs, rising to 14.2% when those programs required major redesign
KPIs impacted: Time to first sale, onboarding completion rate, first-year retention
When this matters most: High-growth organizations scaling headcount rapidly, sales teams entering new markets, or environments launching new product lines
Quota Attainment and Revenue Predictability
Quota attainment — the percentage of reps hitting or exceeding their sales target — is the most direct measure of whether the sales organization is performing at the level the business needs. Persistent inconsistency in this metric points to enablement gaps, not market conditions.
Current benchmarks make the stakes clear. Salesforce's 2024 State of Sales report found that 84% of reps missed quota in the prior year. The Ebsta/Pavilion 2024 B2B Sales Benchmarks report, analyzing over 4.2 million opportunities, found that only 15% of sales teams had more than half their reps achieve 80%+ of quota.
Organizations with dedicated sales enablement functions saw 57.3% quota attainment, compared to 46.7% for those without — a 10-point gap that compounds directly into revenue predictability.
When more reps hit quota consistently, forecast accuracy improves. That gives leadership reliable data for resource planning, hiring decisions, and growth projections.
KPIs impacted: Quota attainment %, average revenue per rep, sales cycle length
When this matters most: Quarter-end pressure periods, post-reorg teams adjusting to new territories, organizations deploying new products where rep readiness directly affects pipeline conversion
Lead Measures vs. Lag Measures: The Framework That Connects Training to Outcomes
Most enablement programs don't fail because the training is poor. They fail because leaders track the wrong metrics.
Lag measures show what already happened:
- Win rate
- Quota attainment
- Average deal size
- Sales cycle length
Lead measures predict what is likely to happen:
- Training completion rate and quality
- Skill proficiency scores
- Role-play performance ratings
- Coaching session frequency
- Knowledge retention scores
Organizations that only track lag measures are always reacting to results they could have anticipated. By the time win rate drops, the quarter is often already lost.
How Lead Measures Work in Practice
Each lead measure connects to a downstream revenue outcome:
| Lead Measure | What It Predicts |
|---|---|
| Low objection-handling scores | Declining win rates in late-stage deals |
| High ramp milestone completion | Shorter time to first deal |
| Low coaching session frequency | Plateau in quota attainment |
| High training completion, low retention scores | Training design problem, not compliance problem |
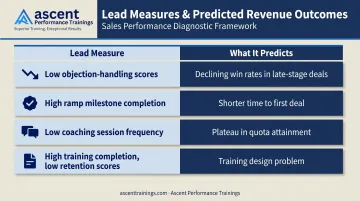
High training completion paired with flat win rates doesn't mean reps aren't engaging: it means the training isn't changing the right behaviors. Metrics expose this disconnect and give leaders the evidence needed to redesign the program rather than mandate more participation.
Using Both Layers Together
The most effective approach is to compare trained cohorts against untrained cohorts on lag measures. If reps who completed a specific program show measurably higher win rates or shorter sales cycles than those who didn't, the training is working. Yet CSO Insights found that only 25.7% of organizations track both layers consistently — which means most revenue leaders are making program decisions without the data to know whether those programs are working.
What Happens When Sales Enablement Metrics Are Ignored
The consequences aren't abstract. They're operational and financial.
Inconsistent results with no explanation. Some reps consistently outperform others, but without metrics connecting training activity to performance, the behaviors driving success remain invisible. Top-performer habits can't be replicated if they can't be identified. Ebsta/Pavilion's 2024 data found that 17% of reps generated 81% of revenue — a concentration that reflects an enablement gap far more often than individual talent.
Reactive management replaces proactive coaching. Without lead measure tracking, managers only discover problems when quota is missed or win rates drop. By that point, the window to intervene during the sales cycle has already closed. Proactive coaching — the kind that prevents misses before they happen — requires leading indicators.
Rising costs and wasted investment. Ineffective training programs continue to consume budget because there's no measurement system to flag underperformance. RAIN Group reports that without reinforcement, up to 77% of sales learning is forgotten within six days.
That loss isn't a motivation problem — it's a retention problem. Without reinforcement built into the program, learning evaporates. High ramp-time costs then compound with turnover when onboarding gaps go undetected until new hires fail.
How to Get the Most Value from Sales Enablement Training
The gap between tracking metrics and actually improving performance comes down to one thing: what you do with the data. Four practices separate teams that move the needle from those that just report on it.
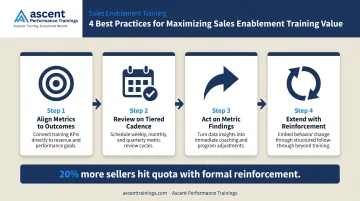
Align metrics to training outcomes before the program begins. Identify 2–3 specific lag measures you intend to move — win rate, time to first deal, or quota attainment — then select the lead measures that predict movement in those outcomes. This alignment ensures training is designed to change the right behaviors, not just fill a learning calendar.
Review metrics on a consistent, tiered cadence:
- Weekly or bi-weekly: Training completion, coaching session frequency, skill scores
- Monthly or quarterly: Win rate, quota attainment, sales cycle length
Without a regular review rhythm, data accumulates but decisions don't. Irregular cadences break the feedback loop before it can produce any change.
Act on what the metrics reveal — don't just document them. When skill assessment scores plateau, adjust the training content. When win rates dip at a specific deal stage, add targeted coaching or role-play scenarios for that stage. Metrics only deliver value when they trigger a change in training design, coaching focus, or rep support.
Extend training beyond the initial program with structured reinforcement. Most organizations treat program completion as the finish line — and that's where gains erode. RAIN Group's research shows that companies providing formal post-training reinforcement see 20% more sellers achieve quota than those that don't, yet only 44% of organizations currently offer any formal reinforcement at all.
That gap is exactly what Ascent Performance Trainings built its 8-week post-training reinforcement program to close. The program runs weekly AI-generated micro-learning videos and monthly 1:1 coaching sessions to embed the behaviors developed during initial training — protecting the metric gains rather than watching them fade. As one VP of Sales noted after completing the program: "The post-training follow-up ensured we didn't just retain knowledge but actually applied it. Our team's performance and closing rates have never been higher."
Conclusion
Sales enablement metrics only matter when they change behavior. When training programs connect to measurable outcomes, leaders stop guessing about what's working and start making decisions grounded in evidence.
Organizations that measure consistently, act on their findings, and reinforce training over time move past one-time win rate gains. Each training cycle builds on the last, because the metrics show precisely where performance broke down and what to target next.
Frequently Asked Questions
What are the KPIs for sales enablement?
Sales enablement KPIs split into two categories: activity KPIs (training completion rates, skill proficiency scores, coaching session frequency) and outcome KPIs (win rate, quota attainment, sales cycle length, time to first deal). The most effective programs track both types together, using activity metrics to predict and influence outcome metrics before results deteriorate.
What are the 5 pillars of sales enablement?
The five commonly recognized pillars are content, training, coaching, tools/technology, and performance measurement. Measurement validates whether the other four are working — without it, organizations can invest heavily across all pillars with no way to identify what's actually driving results.
How does sales training directly improve win rate?
Training improves the specific behaviors — objection handling, discovery, closing technique — that determine win/loss outcomes at the deal level. Win rate improvement becomes measurable when trained cohorts are tracked against baseline performance, making it possible to attribute gains to specific programs rather than market conditions.
What is the difference between lead and lag measures in sales enablement?
Lag measures (win rate, deal size, quota attainment) show results after they've already occurred. Lead measures (training activity, skill assessments, coaching frequency) predict future outcomes. Tracking lead measures enables proactive management. Skill gaps and pipeline problems get caught before they become missed quarters.
How often should sales enablement metrics be reviewed?
Activity-based lead metrics should be reviewed weekly or bi-weekly; outcome-based metrics monthly or quarterly. Cadence matters less than consistency. Irregular review breaks the feedback loop that converts measurement into improvement.
What happens to win rates when sales training reinforcement stops?
Without reinforcement, skill retention declines rapidly. RAIN Group's research indicates up to 77% of sales learning is forgotten within six days. Win rate gains erode as old behaviors reassert themselves, making ongoing coaching and structured reinforcement a prerequisite for sustaining results.